With every new PeopleTool release PeopleSoft continues to enrich Pivot Grid functionality. Pivot Grids offer a strong option for analytical reporting needs. Whether presented in an operational dashboard as a Pagelet or viewed using the Pivot Grid Viewer, the data needed to manage the company will be at your user’s fingertips.
The following is an example of an Absence Management Pivot Grid from PeopleSoft Human Capital Management that explores types of Absence Takes recorded by employees.
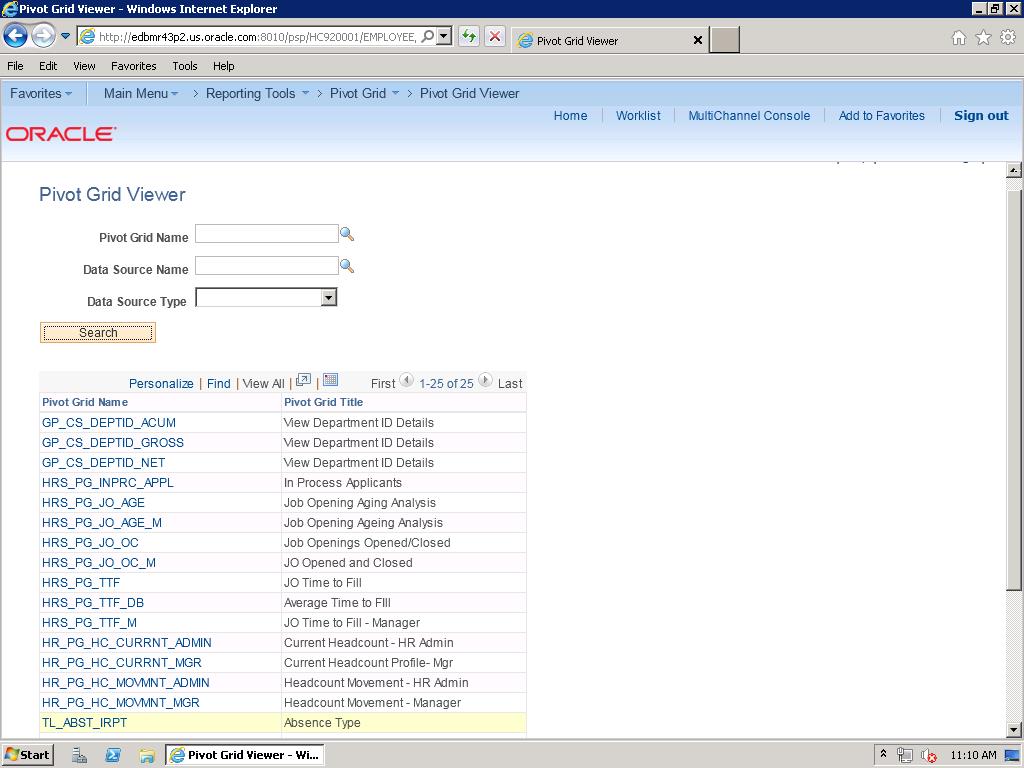
The user opens the Pivot Grid Viewer.
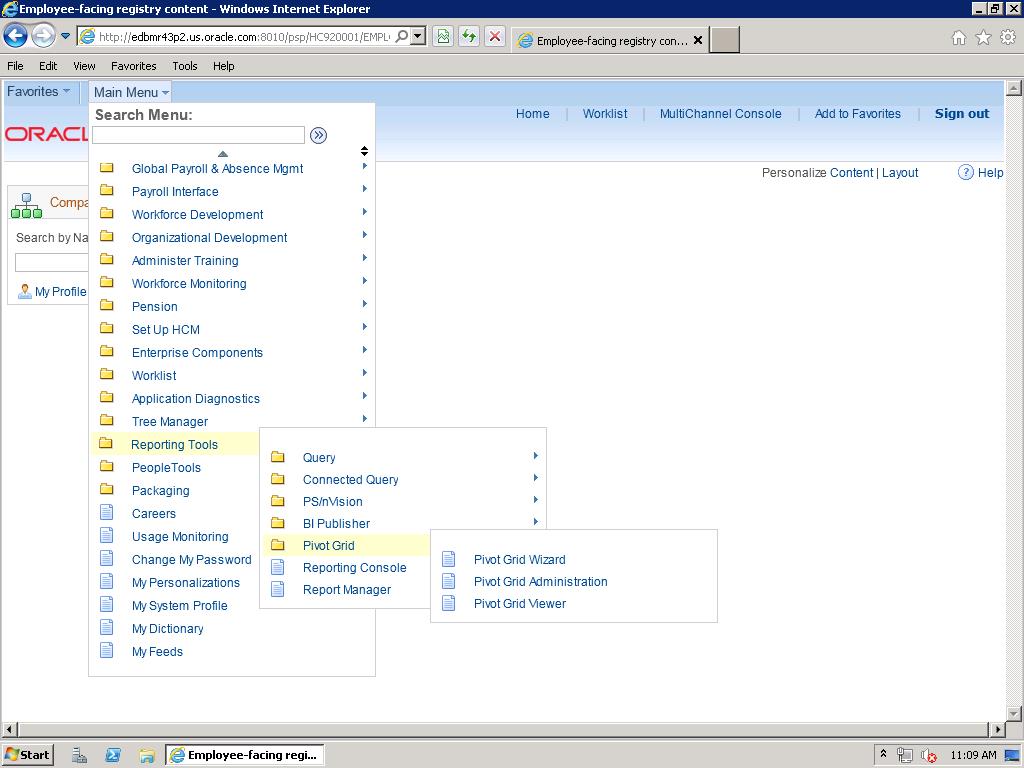
Next the user selects the desired Pivot Grid.
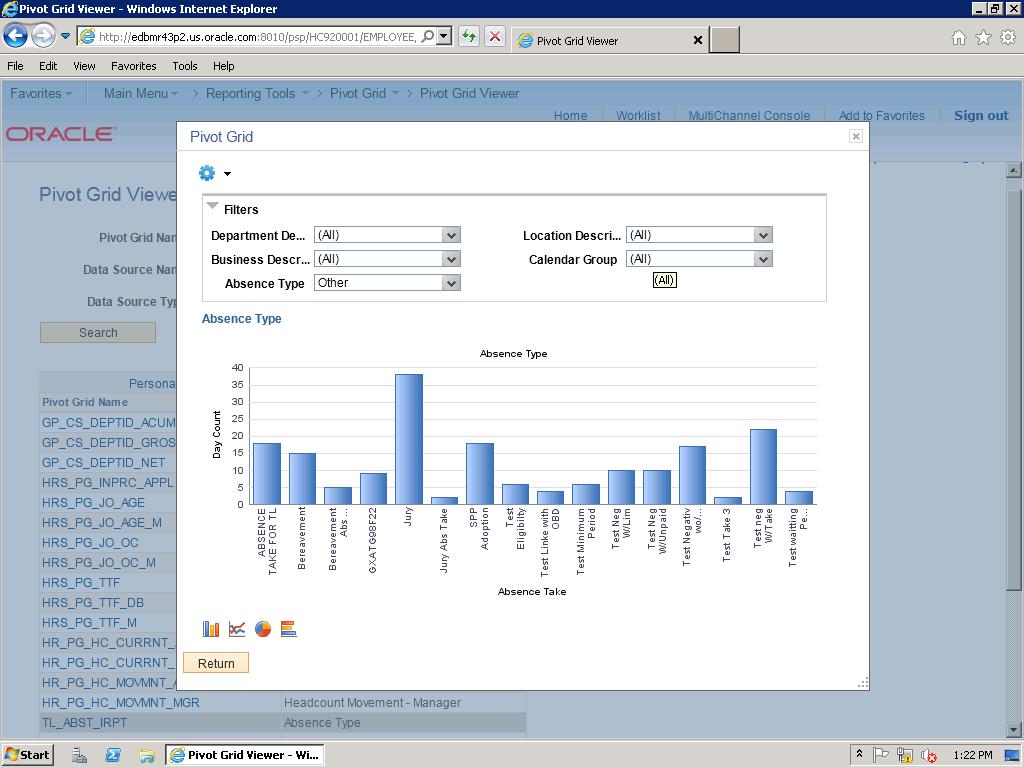
The Pivot Grid displays. Pivot Grids can display data in Chart only, Grid only or both. This Pivot Grid defaults to displaying in Chart first.
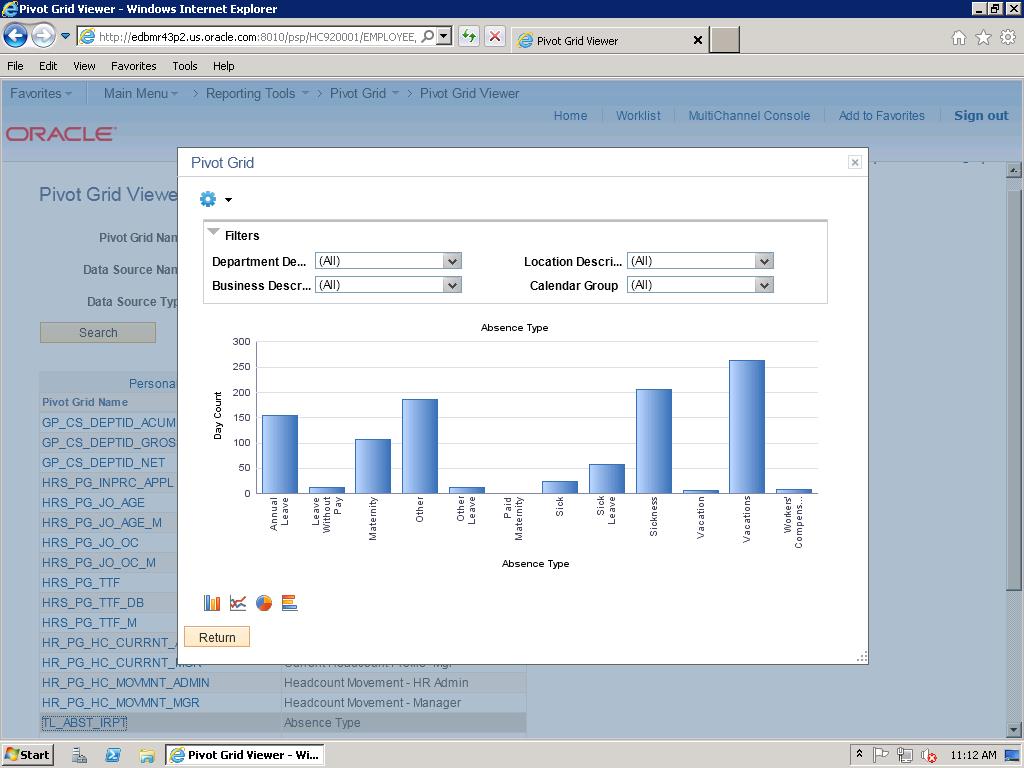
The user notices that Absence Type of “Other” seems higher than normal. The user decides to drilldown to get more information on the specific takes involved.
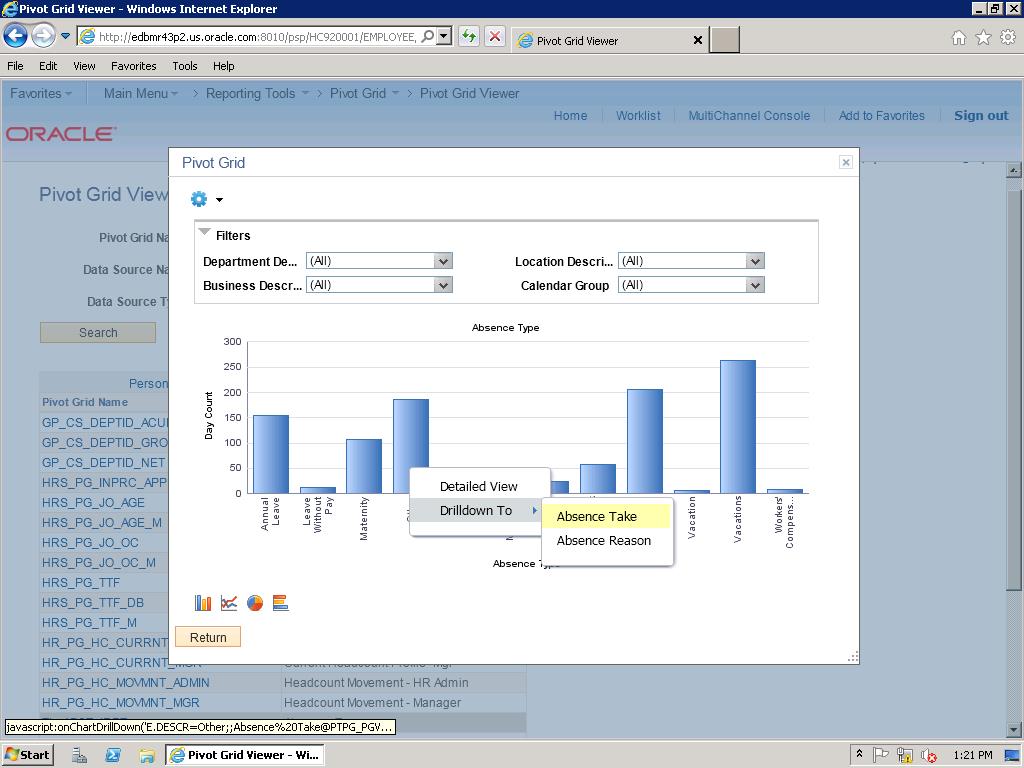
The user discovers that there was a high amount of Jury takes during the period.
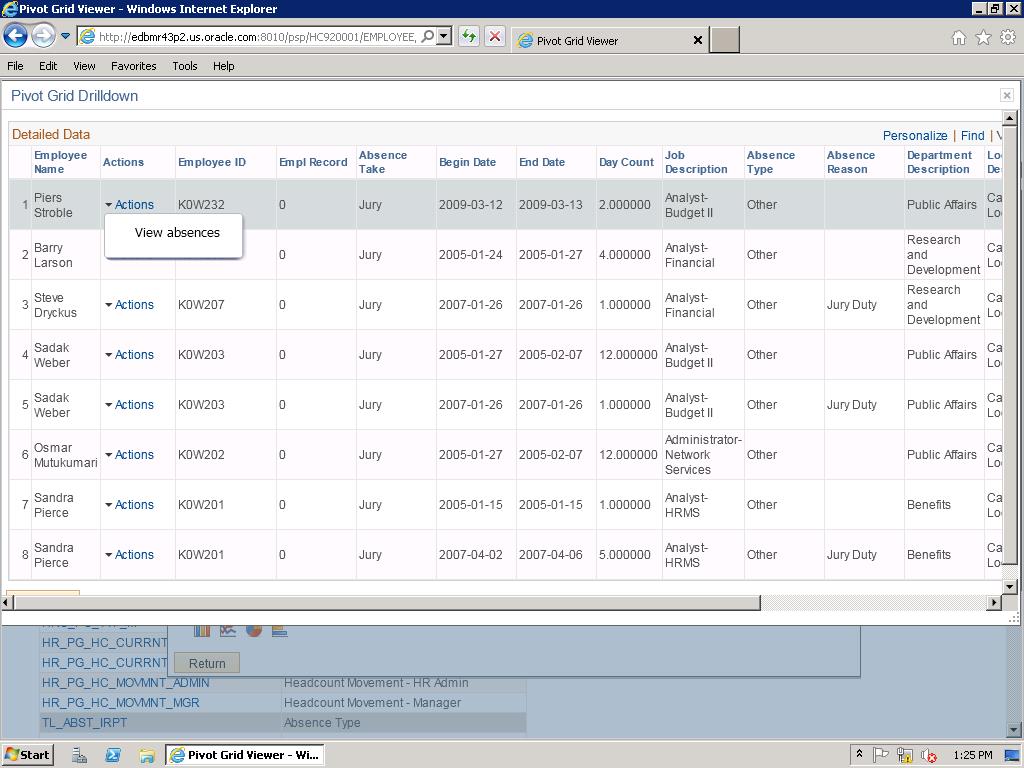
Interested to know more, the user displays the detail behind the Jury bar on the chart. Once there, the user can click the Actions link to be taken to View the absences for a particular employee. The related actions available depend on the configuration of a particular Pivot Grid.
The user can change the Prompt values used to generate the data. The prompts available depend on the underlying query used to support the Pivot Grid. Data can be exported via Export Data on the Options menu, from Pivot Grid Drilldowns, or from the View Grid.
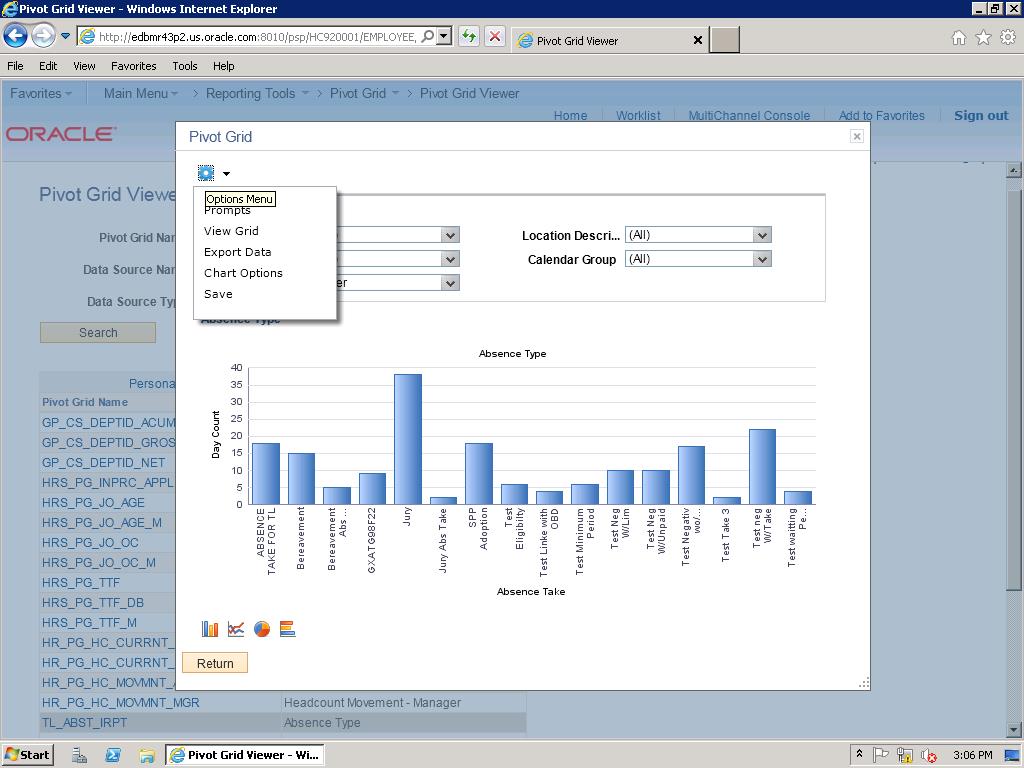
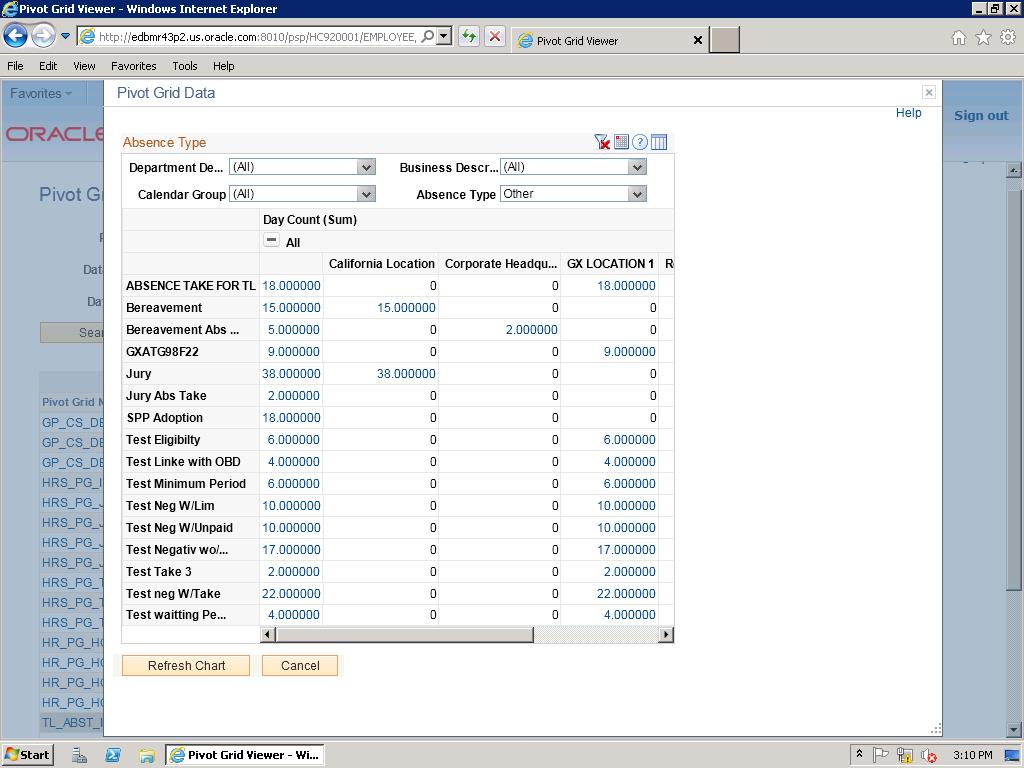
The user selects View Grid from the Options Menu and then drags Location Description from the Filters to the column in order to see the Absence Takes by Location. The California location accounts for all of the Jury takes.
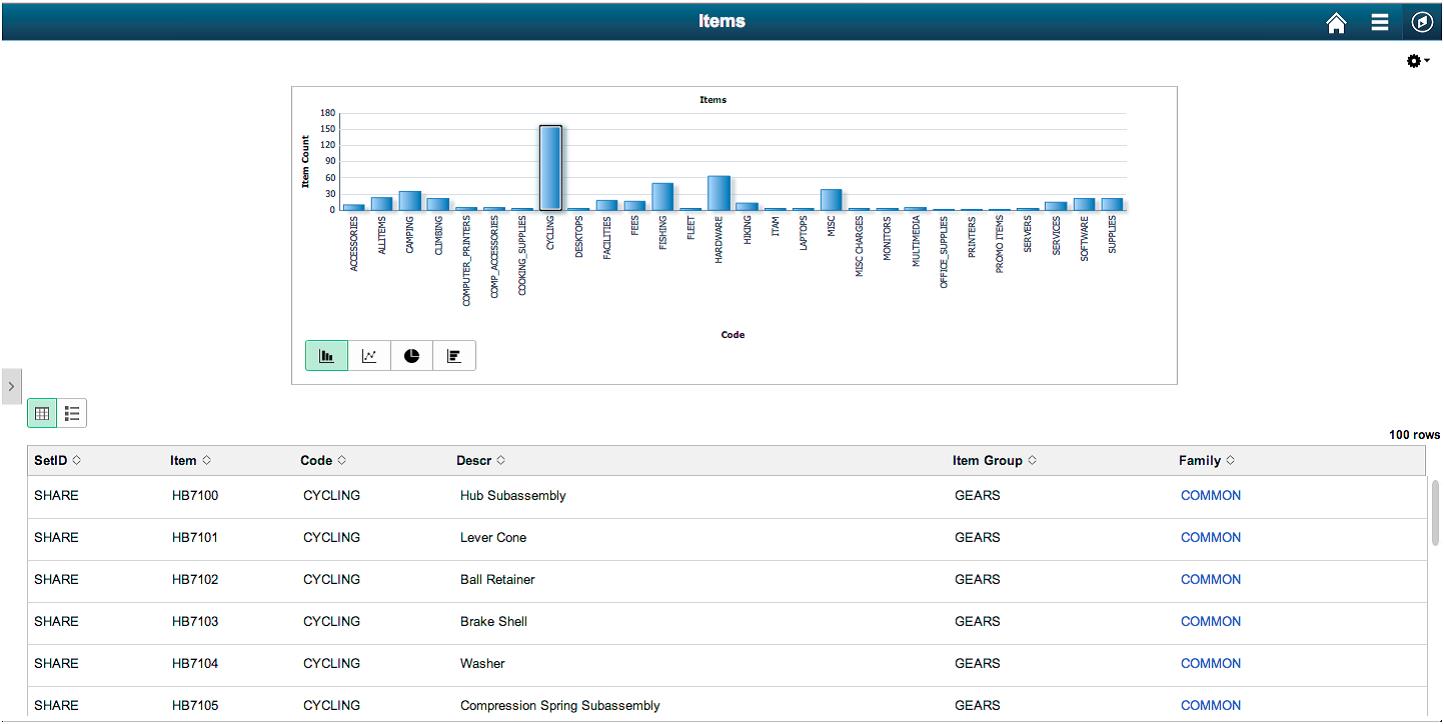
If you have implemented PeopleTools 8.54, the Pivot Grid Fluid Viewer presents Pivot Grids in a touch friendly interface for use on phones, tablets and laptops. Here is an example using the Fluid Viewer to review Items by Item Code. The user has tapped the bar for Cycling and the Detail list below the chart is automatically filtered for that code.
Also new in PeopleTools 8.54 you are able to create Pivot Grid models using Component as the data source.
To learn more about creating Pivot Grids consider taking the new two day course PeopleSoft Pivot Grid Rel 8.54.
Contact us at education@destech.com for more information.


